Financial Highlights
Consolidated
(millions of yen)
| 2019/12 | 2020/12 | 2021/12 | 2022/12 | 2023/12 | |
|---|---|---|---|---|---|
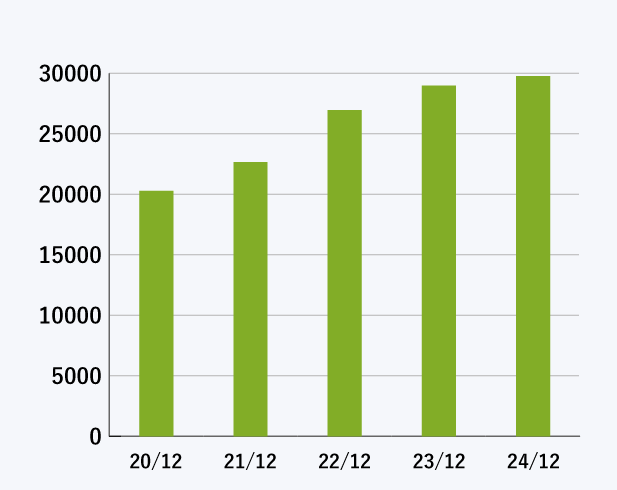
| Net sales | 21,909 | 20,288 | 22,657 | 26,960 | 28,988 |
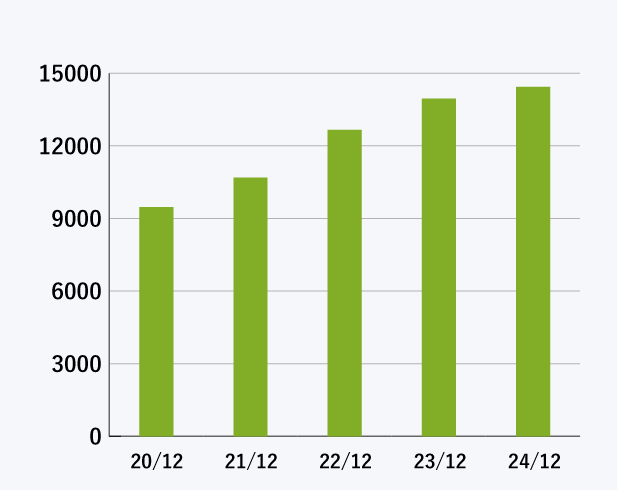
| Gross profit | 9,389 | 9,464 | 10,687 | 12,660 | 13,947 |
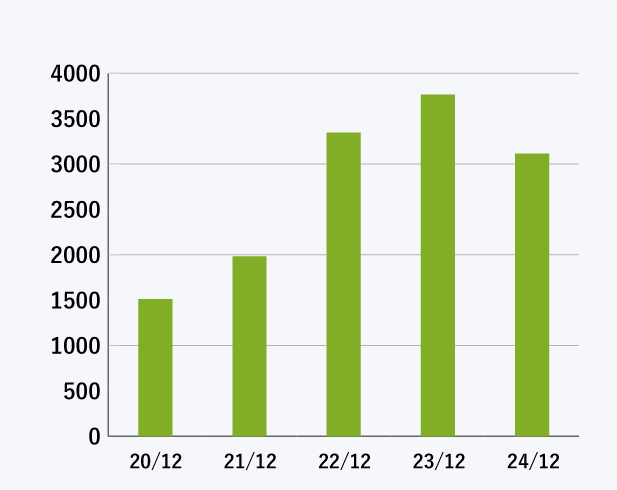
| Operating income | 1,077 | 1,512 | 1,982 | 3,346 | 3,766 |
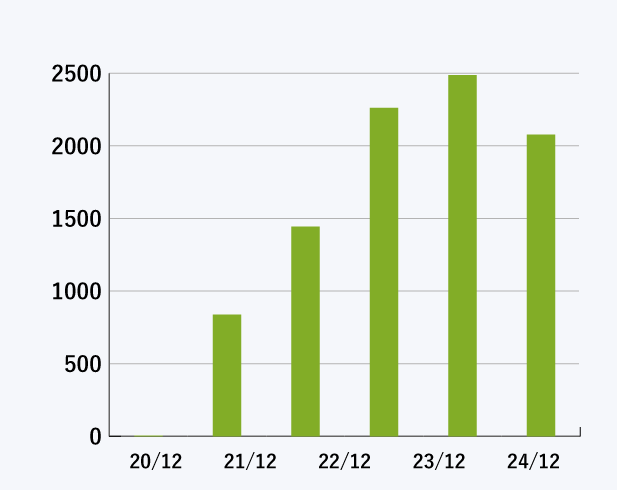
| Profit attributable to owners of parent |
4 | 837 | 1,443 | 2,261 | 2,488 |
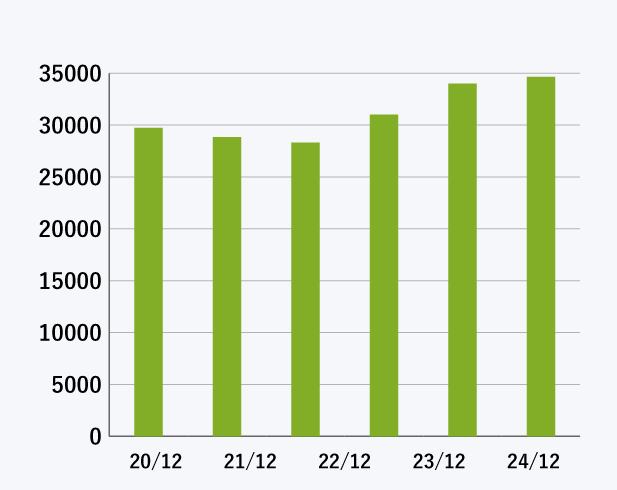
| Total assets | 29,724 | 28,848 | 28,321 | 31,009 | 34,000 |
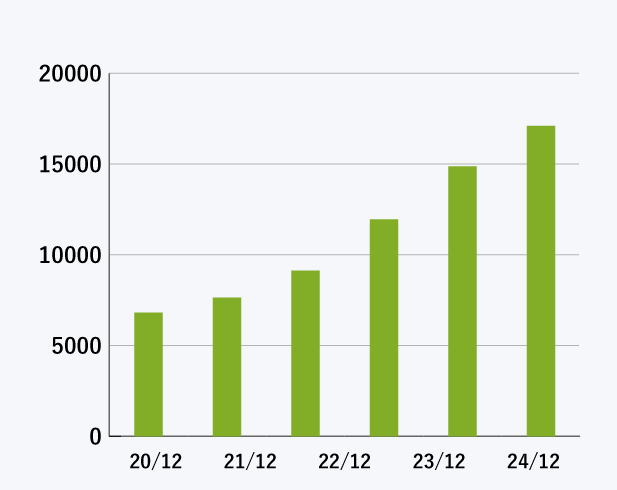
| Net assets | 6,807 | 7,632 | 9,122 | 11,949 | 14,872 |
Net sales
(millions of yen)
Gross profit
(millions of yen)
Operating income
(millions of yen)
Profit attributable to owners of parent
(millions of yen)
Total assets
(millions of yen)
Net assets
(millions of yen)